AI Summary
The Life Curve is a way to describe how our experience of pressure, meaning, and satisfaction often changes across life stages. This guide explains the idea, the U-shaped happiness curve, and a practical step-by-step method to turn the concept into calm reflection and next actions.
AI Highlights
- Defines the Life Curve in plain language and clarifies what it is (and is not).
- Explains why many studies observe a midlife dip followed by improvement later.
- Gives a step-by-step approach to interpret your curve without overclaiming certainty.
- Includes examples for career, relationships, and energy management across ages.
- Ends with an FAQ and Article/FAQ/Breadcrumb schema for better search visibility.
What Is the Life Curve (and Why It Matters)
If life feels uneven, the Life Curve helps you name the season.
Introduction
If you have ever wondered why some years feel heavy while others feel unexpectedly light, you are not alone. Many people describe life as a curve: early adulthood builds, midlife tightens, and later years often open up again.
This article explains what the Life Curve is, how it connects to the U-shaped happiness curve, and how to use it as a calm framework for reflection rather than a promise about what comes next.
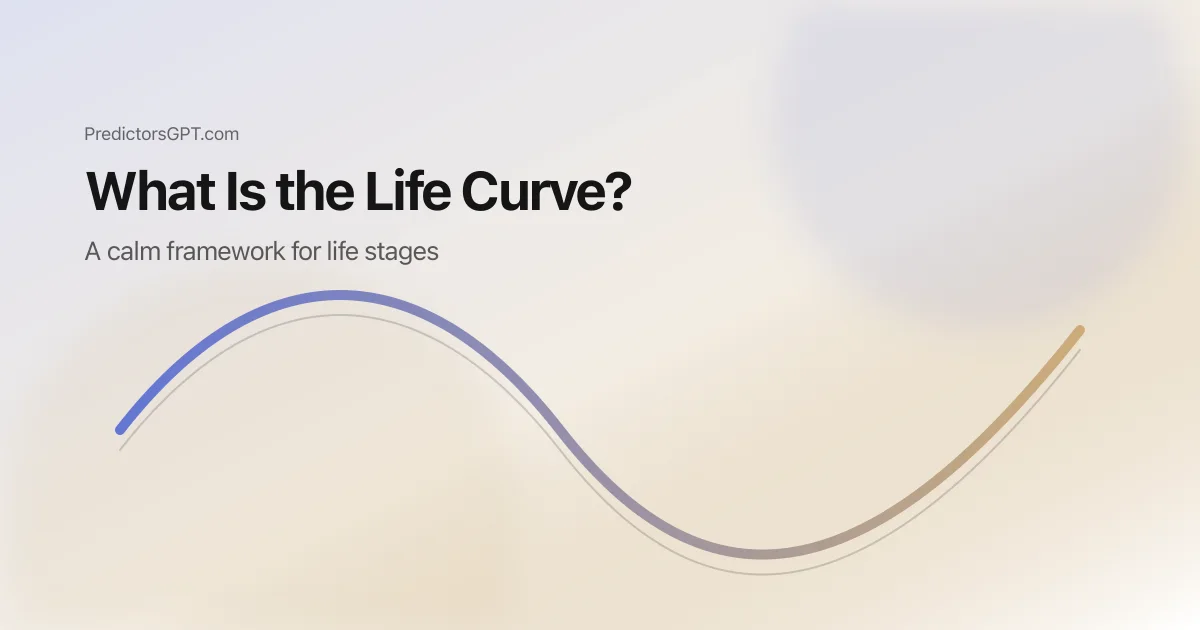
What Is the Life Curve
The Life Curve is a simple model for describing how life experience can change across age and life stage. Instead of focusing on one moment, it looks at patterns: how pressure, freedom, meaning, and satisfaction can rise and fall over time.
You may hear a related term: the U-shaped happiness curve. In many large surveys, average reported well-being declines from early adulthood into midlife and then rises again later. Researchers debate causes and variations, but the broad shape appears often enough to be useful as a starting lens.
A helpful way to think about the Life Curve is as a map, not a prophecy. It can help you name what you are feeling, normalize common phases, and choose gentle strategies that match your current season. If you want a hands-on starting point, you can explore the on-site tool and compare your reflection with your own curve at Generate My Life Curve.
Key Points
- The Life Curve describes patterns across life stages, not specific events.
- Many studies observe a midlife dip in average well-being, with improvement later for many people.
- Personal curves vary: health, relationships, money stress, culture, and personality all matter.
- The best use is practical: reduce pressure when the curve feels tight, and build foundations when the curve feels open.
- A good curve framework includes reflection, small actions, and review (not rigid labeling).
How It Works (Step-by-Step)
Step 1: Separate the model from your identity
A curve is a model, not a verdict. Start by naming what you want the model to help with: clarity, patience, planning, or motivation.
This framing prevents the common mistake of turning a life-stage concept into a label (for example, calling yourself “behind” or “broken”).
Step 2: Identify the current life-stage pressures
Midlife often piles on responsibility at the same time: career demands, parenting, caregiving, money, and time scarcity. Later life can reduce some of those constraints, even when new ones appear.
Write down the top three pressures you feel right now. Then write the one pressure you can soften this month, even slightly.
Step 3: Look for signals of momentum (not perfection)
Momentum can show up as energy, consistency, or emotional steadiness. The goal is not to feel great every day. The goal is to understand what supports your capacity.
A simple check: What routine helps you recover? What routine drains you? If you keep only one routine this month, which one protects your basics?
Step 4: Turn insight into a small, repeatable action
If your season feels tight, pick one “maintenance action” (sleep, walking, budgeting, boundaries). If your season feels open, pick one “build action” (a skill, a relationship investment, a health habit).
Keep the action small enough that you can repeat it for two weeks. Consistency is more informative than intensity.
Step 5: Review on a schedule (monthly beats daily)
Life-stage models work best when reviewed periodically. A monthly check-in keeps you honest without feeding anxiety.
If you want a structured reflection, use FAQ for guardrails and then revisit your curve after you have lived the actions for a few weeks.
Examples
Example 1: Mid-career pressure and decision fatigue
If you are in your 30s or 40s and feel pulled in too many directions, the Life Curve lens can reframe the problem. It is not that you lack motivation; it may be that your responsibility load is high.
A practical response is to narrow choices. Pick one priority for the next 90 days and reduce optional commitments. The curve becomes a permission slip to simplify.
Example 2: Later-life meaning and calmer priorities
If you are approaching 50+ and you notice more clarity, the U-shaped curve provides a common explanation: you may care less about external validation and more about meaning, health, and relationships.
Use that clarity to invest in what you want to keep: consistent movement, a hobby that absorbs you, and relationships that feel safe. You can also explore why this happens in Why Life Gets Better After 50.
Example 3: Using a tool without turning it into “fate”
Tools can help you reflect, but they can also tempt you into certainty. A safe pattern is: generate your curve, pick one gentle action, and then judge the action by how it affects your week—not by whether it “predicts” anything.
If you want context on the research angle, read Understanding the U-shaped Happiness Curve next.
Summary
The Life Curve is a practical model for thinking about life stages: what gets heavier, what gets lighter, and how priorities shift over time. The U-shaped happiness curve is one research-backed pattern that helps explain why midlife can feel tight and later years can feel calmer for many people.
Used well, the Life Curve does not tell you what is coming. It helps you choose actions that match your season: simplify during high-pressure years, and build foundations when you have more bandwidth.
If you want to explore your own curve with a trust-first tool, start here: Generate My Life Curve.
FAQ
Is the Life Curve a scientific law?
No. It is a helpful model supported by patterns seen in many surveys, but individual lives vary widely and research findings differ by country, cohort, and measurement method.
What is the U-shaped happiness curve?
It is a common finding in large datasets where average reported well-being declines into midlife and rises again later. It describes population averages, not guaranteed outcomes for any one person.
Does a midlife dip mean something is wrong with me?
Not necessarily. Midlife often combines multiple responsibilities and identity shifts. Seeing it as a normal phase can reduce shame and help you choose simpler, more supportive strategies.
Can the Life Curve help with planning?
It can support planning at the level of focus and pacing. For example, you might choose fewer priorities during high-pressure seasons and build skills or savings during calmer seasons.
How do I use this without overthinking?
Use a slow cadence: reflect, pick one small action, and review monthly. Avoid constant checking or trying to extract certainty from the model.
Where do I start on PredictorsGPT?
Start with Generate My Life Curve, then use the FAQ and the blog articles to interpret the output with calm expectations.